Excel Plots
Advertisement
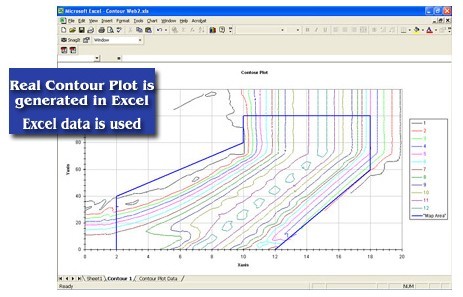
Contour Plot for Excel v.1.01
Create real contour plots in Excel using any data (rectangular, nearly rectangular, or irregular data).
Advertisement
EZplot for Excel v.1.01
EZplot is a plotting and data calculation computer software which enhances Excel. EZplot improves productivity by easily creating many plots in seconds. Plots are defined with parameter names instead of requiring manual selection of data.
Contour Plot v.1 1
Real contour plots are created in Excel. You can interact with the contour plot just like any other Excel plot. Contour Plot works with any contour data. It accommodates rectangular data, nearly rectangular data, and irregular data.
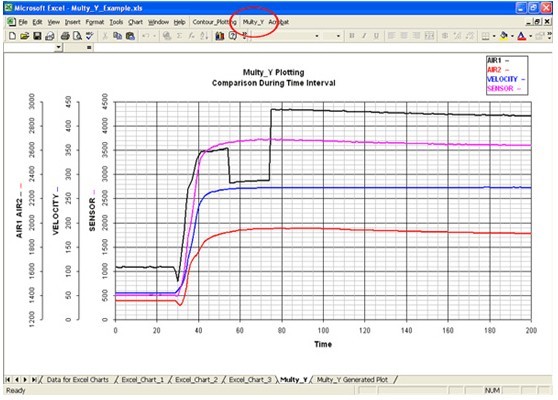
Multy_Y v.1.01
Multiple Y axes plots are created from existing Excel Charts. Each Excel chart appears as a new Y axis on the Multy_Y plot. The plot is a picture that appears on a separate Excel Chart.
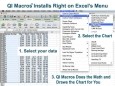
QI Macros SPC Software for Excel v.2016-08
Affordable, easy to use SPC add-in for Excel draws pareto charts, control charts, histograms, box and whisker plots, scatter plots and more. Just select your data and then select a chart from QI Macros menu. Automated fishbone, statistical tests too.
The QI Macros for Excel v.11.0
The QI Macros SPC Software for Excel draws pareto charts, control charts, histograms, box and whisker plots, scatter plots and more. Also includes over 80 fill in the blank templates including QFD, GageR&R, DOE, PPAP and FMEA.
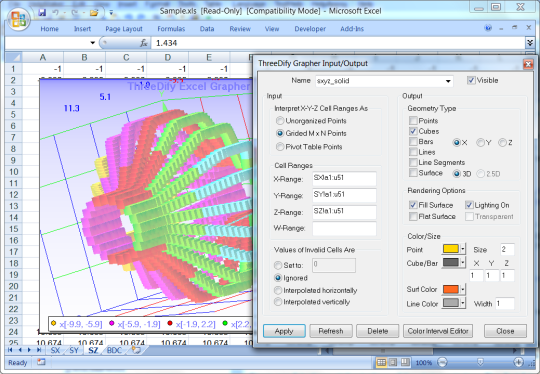
ThreeDify Excel Grapher v.3.2.1
ThreeDify Excel Grapher is an OpenGL-based Excel Addin that plots 3D points, lines, surfaces or water-tight solids directly from user-specified cell ranges within MS Excel worksheets (of one or several open workbooks).

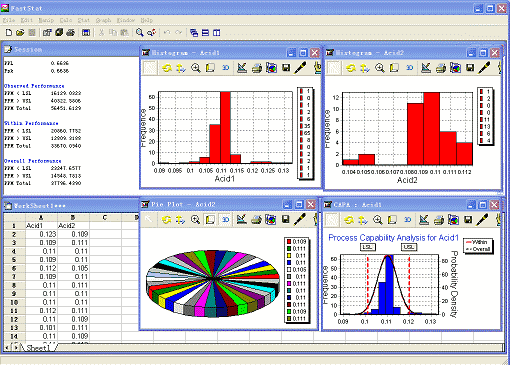
Fast Statistics for Excel v.2.0.3
Fast Statistics is an easy to use Statistical and Graphical Analysis tool for MS Excel , it can work as an Excel add-in, perform from basic data manipulations to the most advanced statistical analyses and produce sophisticated reports and charts.
Multiple Y Axes for MAC Excel 2004 v.1.01
Multiple Y axes plots are created from existing Excel Charts.